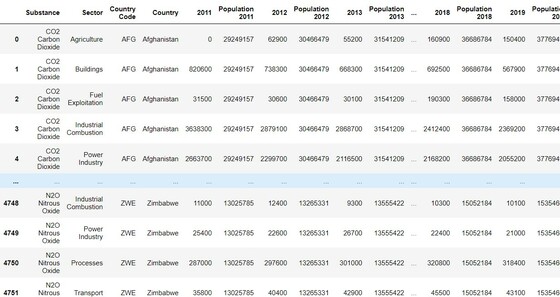


During my participation on the Cambridge Spark Systems Analyst bootcamp, we were introduced to Pandas, a data manipulation, analysis and visualisation library written for the Python programming language. In addition to gaining a comprehensive insight into the product, we were also introduced to additional visualisation tools such as Matplotlib, Bokeh and Seaborn which were used to enhance analysis plots across a wide range of different datasets.
Using the Pandas platform, I was able to identify, isolate and visualise information from the EDGAR (European Database for Global Atmospheric Research) for analysis. The World Bank population dataset was combined into this analysis to better understand the impact of an increasing population on global emissions.
